SHOP NOW, PAY LATER














 Informed Sport
 Informed Choice
 NSF Certified for Sport
 HASTA Certified

DIAAS is the scientifically preferred metric for scoring single-source protein quality when true ileal amino-acid digestibility data exist, because it measures absorption at the amino-acid level rather than relying on a single crude-protein correction. The main caveats are practical: human ileal data are scarce, processing can alter measured digestibility, and DIAAS depends on which reference pattern is applied. PDCAAS still shows up across labels and research because it is cheaper to generate and remains embedded in regulatory practice, so it stays useful when you know exactly how it was calculated.
TL;DR:
- DIAAS can reveal limiting amino acids and better reflect true absorption, but it requires costly, invasive human data or animal models that add uncertainty.
- The choice of reference pattern and digestive model heavily influences the DIAAS value, making it essential to verify these details when comparing protein sources.
- PDCAAS remains more common on labels due to practical constraints, with fecal digestibility overestimating true amino-acid availability, especially in plant-based proteins.
- Until large-scale, validated in vitro methods are available, expect PDCAAS to stay the standard, but DIAAS offers a more precise assessment when relevant data exist.
Table of Contents
- How PDCAAS and DIAAS calculate protein quality
- Why ileal digestibility and amino-acid correction change the outcome
- What the comparative research actually shows
- Why regulations still lean on PDCAAS despite the science
- How to read a published protein quality score correctly
- What still needs to be resolved before DIAAS becomes routine
- Why the science and the shelf label still disagree
- Where to find quality protein once you understand the score
- Sources
- FAQ
How PDCAAS and DIAAS calculate protein quality
Both metrics try to answer the same question: how much of a protein’s amino acid content can the body actually use? They get there through different math, and the difference in method explains most of the disagreements you will see between the two numbers.
PDCAAS multiplies the ratio of a protein’s limiting amino acid (the indispensable amino acid in shortest supply relative to a reference pattern) by the protein’s true fecal crude-protein digestibility. This truncation was written into the method when FAO/WHO recommended PDCAAS in 1991 as a practical, standardized alternative to older biological methods like Protein Efficiency Ratio.
DIAAS works from a different starting point. Instead of one digestibility value applied to the whole protein, DIAAS calculates digestible indispensable amino acid content, in milligrams per gram of protein, for each individual indispensable amino acid and divides that by the amount needed per gram of reference protein. The lowest of these ratios becomes the DIAAS score. Because the correction happens at the amino-acid level rather than the whole-protein level, DIAAS can flag a shortfall in one specific amino acid that a whole-protein correction would smooth over.
The digestibility values feeding into DIAAS matter as much as the formula itself. FAO guidance favors true ileal amino-acid digestibility measured directly in humans. When human data are not available, the accepted fallback order is pig models, then rat models, each adding a layer of extrapolation and uncertainty. Ileal digestibility is measured at the end of the small intestine, before the contents pass into the colon, so it reflects what the body has actually absorbed rather than what survives fermentation by gut bacteria.
For single-source proteins, DIAAS is generally reported without truncation. A decade-long review of the metric confirms that values above 100% should stand as reported for sole-source assessments, since capping them would erase real differences between high-quality proteins like whey isolate and egg. Truncation only applies when DIAAS is used to model the quality of a protein contribution within a mixed diet.
Everything that follows in this comparison traces back to that structural difference.
Why ileal digestibility and amino-acid correction change the outcome
The gap between PDCAAS and DIAAS is not just academic. It comes down to where digestion is measured and how the correction is applied, and both choices affect the final number in ways that matter for real foods.
Fecal digestibility, the basis for PDCAAS, measures what disappears between the mouth and the exit end of the digestive tract. That includes protein absorbed in the small intestine, but it also includes protein and nitrogen that gut bacteria in the large intestine break down and use for their own metabolism. Because that bacterial activity can make it look like more protein was absorbed than the body actually used, fecal digestibility tends to overstate true availability, especially for proteins with a large fiber or resistant-starch component riding alongside them, as is common in many plant-based ingredients.
Ileal digestibility, the basis for DIAAS, is measured at the end of the small intestine, before bacterial fermentation muddies the picture. This gives a cleaner estimate of what amino acids are actually absorbed into the bloodstream for the body to use in tissue repair, enzyme production, or muscle protein synthesis.
The second structural difference is where the correction is applied. PDCAAS multiplies one digestibility number, calculated for the whole protein, against the ratio of the single most limiting amino acid. DIAAS instead applies digestibility separately to each indispensable amino acid before comparing it to the reference pattern. This matters because different amino acids in the same protein are not digested and absorbed at identical rates. A protein could have excellent overall digestibility while its limiting amino acid specifically is absorbed less efficiently, a distinction that a single crude-protein correction cannot capture but an amino-acid-level correction can.
Truncation compounds the difference. DIAAS, left untruncated for single-source assessments, preserves that separation, which is part of why FAO’s more recent guidance favors it for distinguishing between high-quality proteins.
Processing adds a further wrinkle that applies to both metrics but is easiest to explain through DIAAS’s amino-acid-level lens. Heat treatment and drying can trigger Maillard reactions, which bind lysine to sugars and render it biologically unavailable even though standard amino acid analysis still detects the total lysine content. The result is a protein that looks fine on paper but delivers less usable lysine in practice. Because lysine is often the limiting amino acid in cereal-based and some heavily processed protein products, measuring reactive lysine rather than total lysine is increasingly treated as necessary for an accurate DIAAS score on processed foods. A number generated without that correction can overstate quality for a product that has been through significant heat processing.

What the comparative research actually shows
Empirical comparisons back up the theory: PDCAAS and DIAAS do not just differ by small margins, they sometimes rank the same protein differently depending on which method you use.
A rat-based comparison across 14 protein sources found that PDCAAS underestimated DIAAS by 15% for milk protein concentrate and by 8% for whey protein isolate, meaning the older method was actually conservative for those dairy proteins. For several plant proteins in the same study, the pattern reversed sharply, with PDCAAS overestimating DIAAS by as much as several hundred percent in some cases. That is not a rounding difference. It means a plant protein that looks acceptable under PDCAAS could show a materially lower amino-acid-corrected score under DIAAS, largely because fecal digestibility masks losses that ileal measurement catches.
Pig-model data tell a similar story from a different angle. Comparative work summarized in a 2017 British Journal of Nutrition analysis found that PDCAAS-style values tended to run higher than DIAAS for a number of plant ingredients and lower than DIAAS for some dairy ingredients, echoing the direction of the rat findings even though the model animal was different.
Reference pattern choice adds another layer of variation. A 2025 pig-model study reported adult DIAAS values of 60 for white rice, 87 for soy protein isolate, and 131 for skim milk powder, while infant reference patterns, which demand a different amino acid balance, produced lower values for the same ingredients. That single dataset shows why a DIAAS score is meaningless without knowing which age group’s reference pattern was used to generate it.

These comparisons come with real limits. Rat and pig models are proxies for human digestion, not direct human measurements, and the two animal models do not always agree with each other or with the limited human ileal data available. Study protocols vary in how proteins were processed before testing, which reference pattern was applied, and whether truncation rules were followed consistently. Comparing a PDCAAS and DIAAS figure for the “same” ingredient across two different papers can be misleading unless both used matching reference patterns and reporting conventions. The direction of the divergence (plant proteins often penalized more under DIAAS, some dairy proteins scoring better) is a consistent pattern in the literature, but the exact magnitude depends heavily on study design.
Why regulations still lean on PDCAAS despite the science
FAO recommended DIAAS as the more accurate method back in 2013, yet PDCAAS remains the metric behind most protein content claims more than a decade later. The gap between scientific recommendation and regulatory practice comes down to practicality, not disagreement over which method is better.
Generating a true ileal digestibility value, the input DIAAS depends on, is expensive and logistically difficult. Human ileal studies require participants with ileostomies or intubation procedures to sample digesta directly from the terminal ileum, which is invasive, limits sample sizes, and raises ethical and cost barriers that fecal collection for PDCAAS does not carry. Pig models are less invasive than human ileal studies but still require surgical cannulation and specialized animal facilities, which caps how many ingredients can realistically be tested each year.
PDCAAS, by contrast, uses fecal collection, a method that has been standardized for decades, is cheaper to run, and fits within existing regulatory frameworks built around the original FAO/WHO recommendation. Replacing an entrenched, validated system across every jurisdiction that uses it is a slower process than publishing a superior formula.
The path forward that researchers are actively pursuing is in vitro digestion methods that could approximate ileal digestibility without animal or human intubation studies. Standardization efforts through the INFOGEST consortium and parallel ISO and IDF working groups aim to validate an in vitro DIAAS proxy that labs could run at far higher throughput than current animal or human protocols allow. A 2024 review of DIAAS ten years after its introduction frames this validation work as the key remaining barrier: the science behind DIAAS is settled enough to prefer it, but the infrastructure to generate DIAAS values at the scale PDCAAS currently operates at is not yet in place.
Until that infrastructure exists, expect PDCAAS to remain common on labels and in regulatory filings even as DIAAS accumulates more supporting literature. Neither score is a marker of legality or safety, they measure protein quality only, and any claim about what a product is permitted to say on a label depends on the food regulations of the specific market it is sold in.
How to read a published protein quality score correctly
A number alone, PDCAAS or DIAAS, tells you very little without the details behind it. Before drawing conclusions from a reported score, check the method it came from.
- Identify which metric was used and never assume the two are interchangeable or directly comparable without adjustment.
- Check whether the digestibility data came from humans, pigs, or rats, since each step down that ladder adds extrapolation.
- Confirm whether the value was truncated at 100% (typical for PDCAAS) or reported uncapped (typical for single-source DIAAS).
- Note which reference pattern was applied, since adult and infant patterns produce different scores for the same ingredient.
- Verify the tested material matches what you are evaluating, since processing, cultivar, and formulation all shift digestibility.
For anyone buying rather than researching, a second, shopper-focused checklist matters just as much. Confirm the protein source in the product you are looking at actually matches the ingredient the published score refers to, since a “pea protein” score from one study does not automatically apply to a different pea protein isolate processed differently. Check the serving dose against your own daily protein target, since a high-scoring protein still needs to be consumed in adequate amounts, a point covered in more detail in a guide to protein per scoop. Look for any note about heat treatment or drying method, since that affects reactive lysine content. And treat third-party testing as a separate question from amino acid score: one tells you about quality assurance, the other about protein composition.
Pro Tip: Pair a lower-scoring protein with a complementary source in the same meal, such as rice with beans or a grain-based product with a dairy or legume protein, since the amino acids one source lacks are often supplied by the other, raising the effective quality of the combined meal even when neither ingredient scores well alone.
What still needs to be resolved before DIAAS becomes routine
The case for DIAAS as the more accurate metric is strong, but several practical gaps keep it from fully replacing PDCAAS in everyday use.
Human ileal digestibility data remain the biggest shortage. Because direct human measurement is invasive and expensive, most DIAAS values in circulation rely on pig or rat models with regression equations used to estimate what a human value would likely be. That works reasonably well for some protein categories and less well for others, and expanding the human dataset is a stated priority in recent reviews of the metric.
Reference patterns also need ongoing attention. Amino acid requirements differ by age and physiological state, and a DIAAS calculated against an infant reference pattern will diverge from one calculated against an adult pattern for the same ingredient, as the pig-model data on white rice, soy isolate, and skim milk powder illustrated earlier. Agreeing on standardized reporting conventions, so a published DIAAS always states which reference pattern it used, would remove a common source of confusion.
Validating in vitro alternatives is the technical bottleneck standing between DIAAS and wider regulatory adoption. The INFOGEST protocol and related ISO and IDF standardization work aim to produce a validated, higher-throughput proxy for ileal digestibility, but that validation has to happen across enough labs and protein types before regulators will treat it as equivalent to animal or human data.
Finally, single-ingredient scores, whether PDCAAS or DIAAS, describe that ingredient in isolation. Extrapolating an ingredient-level number to a finished, multi-ingredient product or to a full day’s diet requires care, since a whole diet’s amino acid adequacy depends on the combination of everything eaten, not any one protein’s individual score.
Why the science and the shelf label still disagree
I think the biggest misconception in this space is treating a protein quality score as a verdict on a product rather than a measurement with a method attached. DIAAS is the more rigorous tool when ileal, amino-acid-level data exist for the material actually being sold, and the evidence for that is consistent enough across rat and pig studies that I would not recommend defaulting to PDCAAS out of habit.
That said, feasibility matters. Until validated in vitro proxies scale up, most of the world’s protein supply will keep being scored the older way, and a well-reported PDCAAS figure beats an unreported or poorly documented DIAAS figure every time. My practical advice is to demand transparency over prestige: ask what model, what reference pattern, and what truncation rule produced the number in front of you, then weigh that number alongside your total daily protein intake rather than treating a single ratio as the whole story.
— Blake
Where to find quality protein once you understand the score
Knowing how to read a DIAAS or PDCAAS figure is only half the job. The other half is finding a protein product where the ingredient list is transparent enough that the score actually applies to what you are buying. There are available curated ranges of protein powders and related supplements with fully disclosed ingredients, so you can check the source protein against published research yourself rather than guessing.
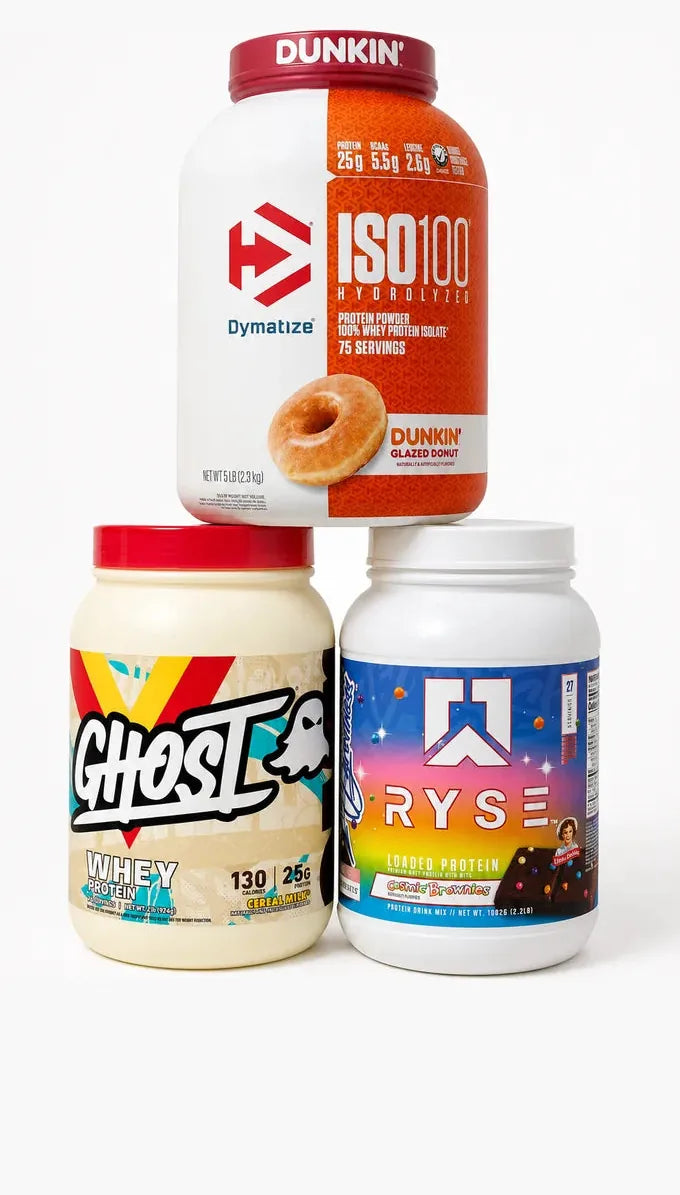
Whichever protein type you land on, pair it with a realistic daily target rather than chasing the highest single-ingredient score, a point covered further in this piece on staying consistent with protein intake. If you are ready to compare products directly, the protein, pre-workout, creatine and other categories are laid out by type so you can check formulation details before you buy.
This article is general information, not a substitute for advice from a qualified doctor. Consult a qualified healthcare professional about your own circumstances before acting on anything here.
Sources
Published figures illustrate how far apart the two scores can land for the same ingredient. These are examples drawn from specific studies, not universal constants, since a different reference pattern, animal model, or processing method would shift the numbers.
- True ileal amino acid digestibility coefficients for application in the calculation of Digestible Indispensable Amino Acid Score (DIAAS) in human nutrition
- Protein Digestibility-Corrected Amino Acid Scores and Digestible Indispensable Amino Acid Scores Differentially Describe Protein Quality in Growing Male Rats
- Pig-model study reporting DIAAS values for multiple ingredients (example values cited in research pool)
The pattern across these entries reinforces what the underlying studies describe: dairy-derived proteins tend to hold up well or even outperform their PDCAAS figure under DIAAS, while cereal and some plant proteins tend to score lower once amino-acid-level, ileal-based correction is applied. Readers comparing pea and soy protein sources specifically will find this divergence relevant, since both are plant proteins subject to the same limiting-amino-acid dynamics described above.
FAQ
What foods have the highest DIAAS score?
Animal-derived proteins such as milk and dairy fractions tend to report the highest DIAAS values, with skim milk powder reaching a DIAAS value over 100% in one pig-model study using an adult reference pattern.
What is a good DIAAS score?
Scores below 100%, such as the 60 reported for white rice in the same pig-model dataset, signal at least one limiting amino acid relative to that reference pattern.
What is the DIAAS score of eggs?
The article’s sourced comparisons do not report a specific DIAAS figure for eggs, so a precise number cannot be stated here without risking inconsistency with the studies cited. Eggs are commonly discussed in the literature as a high-quality reference protein, but readers should consult the FAO-aligned DIAAS methodology directly for verified values by study.
What is the DIAAS score for chicken?
The sources used for this comparison do not include a published DIAAS figure for chicken, so no number is given here to avoid stating an unverified value. Animal-derived proteins generally digest well at the ileal level, but a firm DIAAS figure for chicken should be checked against a specific peer-reviewed measurement rather than assumed.
Should I prefer DIAAS or PDCAAS when comparing supplements?
DIAAS is the more accurate method when ileal, amino-acid-level digestibility data are available for the exact ingredient in question, since it avoids the truncation and whole-protein averaging built into PDCAAS.