SHOP NOW, PAY LATER
















 Informed Sport
 Informed Choice
 NSF Certified for Sport
 HASTA Certified


In New Zealand, a protein bar counts as low sugar when it has no more than 5 g of sugars per 100 g. A per-bar sugar figure can't prove that on its own, because you need the bar weight to work out the concentration. That single point changes how you should rank low sugar protein bars in NZ, so start with the label, then narrow your shortlist from protein bars NZ by sugar per 100 g, protein per 100 kcal and sweetener load together.
Table of Contents
- What Counts as Low Sugar in a Protein Bar
- How to Compare Sugar Fairly on the Label
- Sweeteners and Sugar Sources in NZ Protein Bars
- Price per Serve and Certification for Drug-Tested Athletes
- Where to Buy Low Sugar Protein Bars in NZ
- Choosing a Low Sugar Bar for Your Training and Diet
What Counts as Low Sugar in a Protein Bar
The regulated threshold for a low sugar claim is no more than 5 g of sugars per 100 g of food, according to the Food Standards Code revision threshold for low sugar claims. This measures sugar concentration, not the amount in one bar. A smaller bar can contain fewer grams of sugar while having a higher sugar concentration.
The front-of-pack claim alone does not show how a bar compares with another of a different size. Protein bars range from compact snacks to coated, layered bars, so check the per 100 g column when assessing whether each meets the same threshold.
NZ sugar benchmarks for protein bars
| Benchmark | Threshold | What it means for a bar |
|---|---|---|
| Regulated low sugar claim | No more than 5 g sugars per 100 g | The threshold for a low sugar claim |
| Reduced sugar claim | At least 25% less sugar than the reference food | The reduction does not show whether the final product is low sugar |
A reduced sugar claim describes a comparison with a reference food. It does not confirm that the bar meets the regulated low sugar threshold. A bar may contain at least 25% less sugar than its reference and still have more than 5 g per 100 g. Check the final sugar concentration rather than treating the size of the reduction as the product's sugar level.
If the label gives sugar only per bar, use the bar weight to convert it to a per 100 g figure: divide the sugar grams by the bar's weight in grams, then multiply by 100. For example, the same per-bar sugar amount represents a higher concentration in a lighter bar. That conversion lets you apply the regulated test without relying on arbitrary per-bar categories.
Protein does not change the sugar claim. These are separate measures, and a high protein figure cannot establish that a bar is low in sugar. The same distinction matters when comparing bars for a particular day: the lowest sugar concentration may not provide the protein you need, while a higher-protein option may come with more sugar. Rank options using sugar per 100 g, protein per 100 kcal and sweetener load together, then choose according to what fits that day.
How to Compare Sugar Fairly on the Label
A fair comparison needs three figures: sugar per 100 g, protein per 100 kcal, and protein relative to sugar. Read them together. The lowest sugar figure may suit a light snack, while a higher-protein bar may better match a demanding training day.
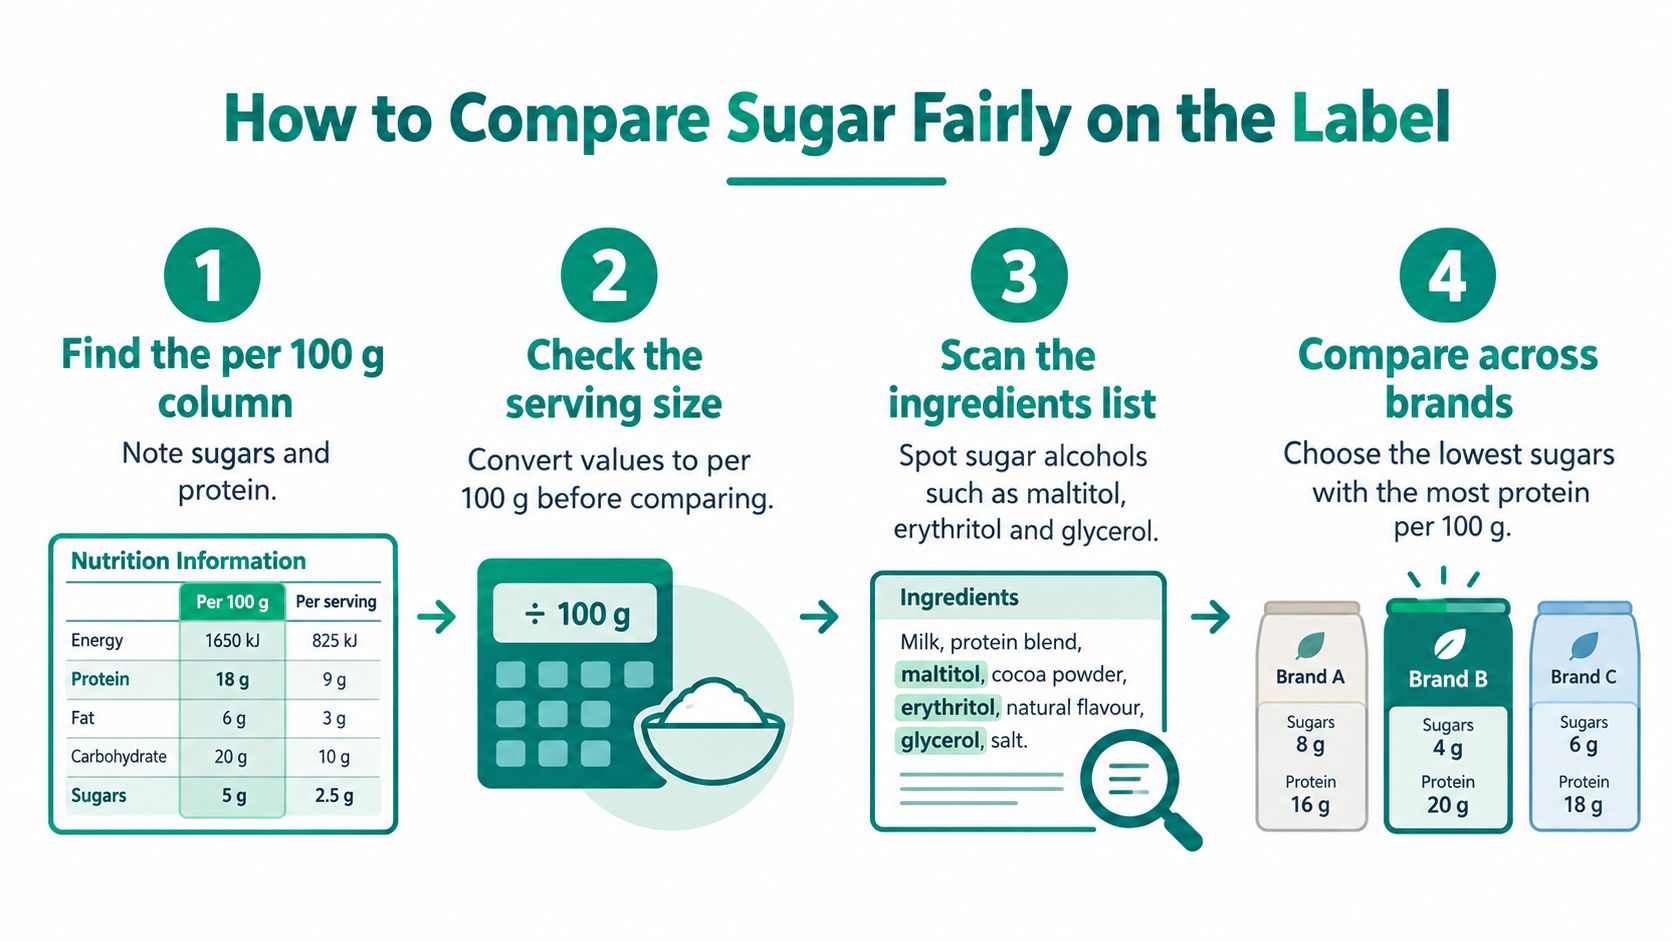
The six label steps
- Find the per 100 g column. Note sugars and protein. This standardises the comparison across bars of different sizes.
- Record the bar's weight in grams. You need it to convert figures given only per serve.
- Check the serving size. One label may define a whole bar as a serve, while another lists part of a bar or several pieces. MPI guidance on checking recommended serving sizes explains how to read serving information.
- Convert per-serve figures if needed. Divide sugar by the serve's weight, then multiply by 100 to calculate sugar per 100 g.
- Calculate the protein-to-sugar ratio. Divide protein grams by sugar grams. A higher ratio means more protein relative to sugar, but does not account for energy or serving size.
- Calculate protein per 100 kcal. Divide protein grams by energy in kcal, then multiply by 100. This shows how much protein comes with a given energy load.
Serving size and concentration answer different questions. Per serve estimates what you eat in the stated portion; per 100 g helps compare the products themselves. Check concentration first, then decide whether the portion suits your snack.
What the worked numbers show
Use the label figures and these formulas: sugar per 100 g = sugar per bar ÷ bar weight × 100; protein per 100 kcal = protein ÷ energy × 100; protein-to-sugar ratio = protein grams ÷ sugar grams.
For example, a 40 g bar with 2 g sugar gives 5 g sugar per 100 g: 2 ÷ 40 × 100. A 60 g bar with the same 2 g sugar gives about 3.3 g per 100 g. The second bar has less sugar relative to its weight, even though both provide the same amount of sugar per bar.
Energy changes the protein comparison. A 200 kcal bar with 20 g protein gives 10 g protein per 100 kcal; a 250 kcal bar with the same protein gives 8 g per 100 kcal. The first offers more protein relative to its energy, while the second provides the same protein in a larger energy allowance.
The ratio adds another view. 20 g protein and 2 g sugar gives a 10:1 ratio; 15 g protein and 5 g sugar gives 3:1. Use this alongside the other figures, not as a standalone ranking.
Rank bars by sugar per 100 g, protein per 100 kcal, and sweetener load together. Then consider bar size and your needs that day. The lowest sugar concentration may not be the most useful choice if you need more protein for the energy, or portion, you have available.
Sweeteners and Sugar Sources in NZ Protein Bars
Two bars can meet the same 5 g per 100 g sugar threshold and still differ in sweeteners, fibre and likely digestive tolerance. Sugar density helps rank them, but it cannot show which ingredients supply sweetness or bulk.
The illustration highlights why the ingredient list deserves a check alongside the nutrition panel.
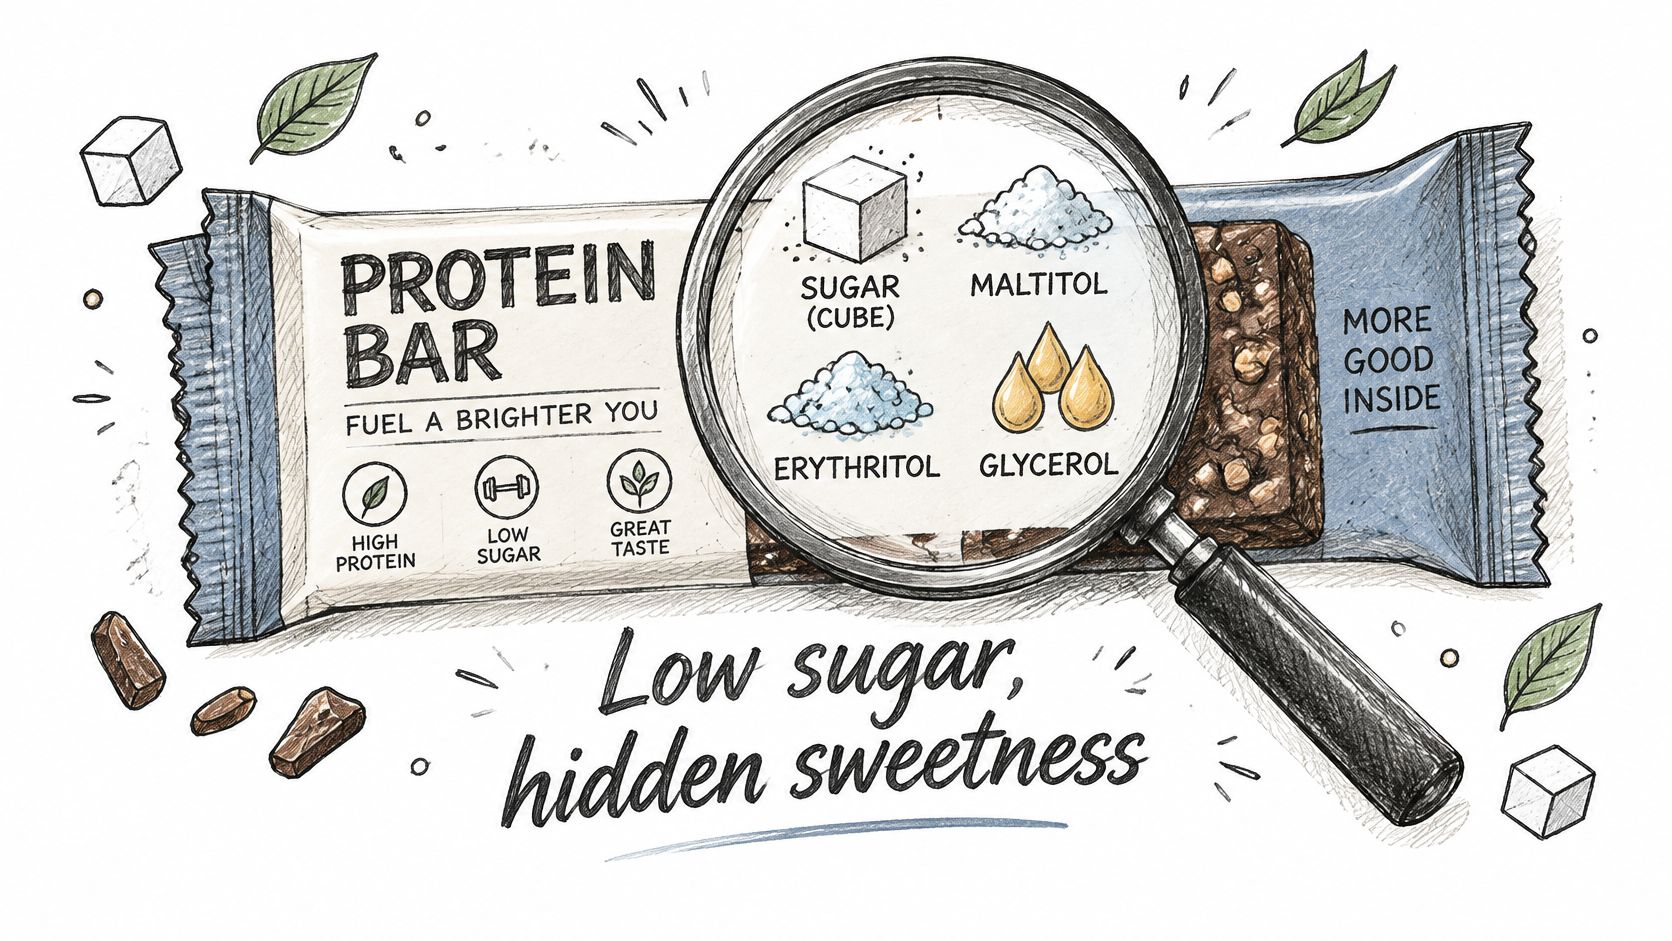
Sweeteners and sugar sources on protein bar labels
| Sugar source or sweetener | Typical label names | Watch for | Best fit |
|---|---|---|---|
| Sugar alcohols | maltitol, erythritol, glycerol | Bloating or loose stools in some people | Everyday snacks, tested in training first |
| Intense sweeteners | sucralose, stevia | Taste varies between brands | Shoppers who want sweetness with little bulk |
| Fibre bulking agents | soluble corn fibre, polydextrose, inulin | Fibre load can upset digestion during exercise | Desk or lunchbox snacks |
| Added sugars | syrups, glucose solids, honey, coatings | Pushes sugar per 100 g up quickly | Check the figure against the 5 g per 100 g test |
| Natural sugars | lactose from milk, fruit sugars from dried fruit | Counted in total sugars but not added | Dairy protein bars and fruit inclusions |
Sugar alcohols provide sweetness and bulk with fewer calories per gram than sugar. Some people experience bloating or loose stools, particularly with larger amounts. If a bar contains polyols, check the guide to sugar alcohols in protein bars and try it before relying on it during training.
Intense sweeteners, including sucralose and stevia, are used in small amounts and add sweetness with little bulk. Fibre ingredients such as soluble corn fibre, polydextrose and inulin can add texture and raise the fibre figure while replacing some of sugar's bulk. Check the ingredient list as well as the total fibre: a high number alone does not show how the bar will feel during exercise.
Added sugars are easier to identify. Syrups, glucose solids, honey and chocolate or yoghurt coatings can raise sugar per 100 g quickly. Lactose in milk ingredients and sugars in dried fruit contribute to total sugars, but are not added sugars. Read the ingredients to distinguish the sources rather than treating every gram of total sugar as added sugar.
New Zealand's adult guidance recommends keeping free sugars below 10% of total energy intake, with a further suggested limit below 5% to help prevent tooth decay, as set out in the Ministry of Health eating and activity guidelines for New Zealand adults. That guidance concerns free sugars, while a nutrition panel's total sugars figure is broader.
The video below offers background on checking ingredients as well as the front-of-pack claim.
One bar, two readings
Consider a hypothetical 50 g bar with 2 g sugar per bar. Its sugar density is 2 g ÷ 50 g × 100 = 4 g per 100 g, so it meets the 5 g per 100 g test. That calculation ranks its sugar concentration, but it does not tell you how much protein it provides per 100 kcal or whether its sweeteners suit your gut.
Ingredient order adds another reading. Polyols and added fibres may help keep sugar low, yet a combination of them could be less comfortable before exercise. The MPI health and nutrition claims regulation material covers rules for nutrition and health claims, not the label figures of a particular bar. Use the product's own pack to check its sugar, protein, energy and ingredients.
Is the bar's low sugar figure paired with a suitable protein-to-energy balance and ingredients you tolerate?
Check three things before buying a box:
- A run of polyols: Several sugar alcohols high in the ingredient list suggest they contribute substantially to sweetness and bulk.
- A fibre blend: Multiple added fibres may affect comfort during exercise, even when the nutrition panel's fibre figure looks useful.
- A coating ahead of the protein source: Check sugars and total carbohydrate when coatings or sweetened inclusions appear early in the list.
These are prompts for a practical trial, not automatic reasons to reject a bar. A higher-fibre bar may suit a desk snack, while one that is unfamiliar could be a poor choice before a run. For a useful comparison, rank sugar per 100 g, protein per 100 kcal and the sweetener and fibre load together. The lowest sugar number is only useful if the rest of the bar fits the day.
Price per Serve and Certification for Drug-Tested Athletes
Price comparisons fail when shoppers compare box prices. Boxes differ in bar count, bar weight and protein per bar. Convert the price first.
Price per serve is the shelf price divided by the number of servings in the pack. Price per 20 g of protein is the price per bar divided by protein grams per bar, multiplied by 20. The second figure is the fairer one if protein is why you're buying the bar.
A worked cost example
For example, a box of 12 bars at $60 works out to $5.00 per bar. If each bar provides 20 g protein, that's $5.00 per 20 g of protein. A different bar at $4.00 with 15 g protein costs $5.33 per 20 g, so the cheaper bar is dearer per gram of protein.
That's an illustrative calculation, not a listed product. Use the live shelf price and the label in front of you. Flavour deals, mixed boxes and changing pack sizes can all move the result.
Value still isn't price alone. A low cost bar you won't eat, or one that upsets your stomach in training, isn't good value. Rank price after sugar per 100 g, protein per 100 kcal and tolerance. Otherwise you'll optimise the cheapest problem.
Certification schemes for sports nutrition
| Certification | What it tests | Who it suits |
|---|---|---|
| Informed Sport | Batch testing against banned substance lists | Drug tested athletes who want a logo tied to batches |
| Informed Choice | Batch testing for banned substances | Athletes who want an independent batch check |
| NSF Certified for Sport | Batch testing against banned substance lists | Athletes who need a named certification scheme |
| HASTA | Testing against prohibited substances for sport | Athletes competing under Australian drug free programmes |
Certification attaches to a named product and batch, not to a whole brand in the abstract. Check the logo and batch details on the pack you receive. Don't assume every flavour, format or production run carries the same status because another product from the same brand does.
If you need the background, read how supplements are tested for banned substances and then confirm the certified product matches your sport's testing rules before you buy. The certifier's current listing is the check that matters.
Certification speaks to banned substance testing. It says nothing about sugar level, taste or stomach tolerance.
Keep those jobs separate. Use the panel for sugar and protein. Use the ingredient list for polyols, fibres and allergens. Use certification for drug testing risk. A certified bar can still be the wrong snack before competition if you haven't trialled it, and a well tolerated bar without the right certification may be unsuitable for a tested athlete.
Where to Buy Low Sugar Protein Bars in NZ
For the same bar, flavour and pack size can change what you pay per serve. Start with the live NZ Supps product page, where current stock, available flavours, pack options and shipping terms are listed. Compare the price per serve across pack sizes before adding a box to your cart.
Stock and prices change. Use the current product page rather than an old screenshot or saved price. Check that the flavour and pack size shown at checkout match the option you intended to buy.
Checkout checklist
- Check current stock: Confirm the listing is available on the day you order.
- Compare flavour and pack size: Product pages may offer different options, so check the selection before checkout.
- Calculate price per serve: Divide the pack price by the number of bars, then compare like-for-like pack sizes. A larger pack may lower the unit cost, but only if you expect to use it.
If shipping affects the total, check the live NZ Supps page for its current terms before placing the order. That gives you the delivered cost to compare, rather than relying on a shipping threshold that may have changed.
Choosing a Low Sugar Bar for Your Training and Diet
A bar with 5 g of sugar per 100 g can still be a poor fit for a particular day. Compare three measures together: sugar per 100 g, protein per 100 kcal and sweetener load. The first shows sugar concentration, the second shows how much protein you get for the energy, and the third helps assess ingredients that may affect taste or digestion.
The right balance depends on when you plan to eat the bar and what else you need from it. Total carbohydrate, energy, fibre and tolerance can matter more than a small difference in sugar. A low sugar figure is one useful screen, not a complete ranking.
Matching the bar to the person
Drug-tested competitive athletes should check certification before preference. Confirm that the named product and batch match the relevant certification, then check the requirements of your sport. Trial the bar during training first. A new bar containing polyols or a large amount of added fibre is a poor experiment on competition day.
Endurance and team sport athletes should consider total carbohydrate and energy as well as sugar. Around longer or harder sessions, those nutrients may be useful. A very low sugar, high fibre bar may sit poorly before a session, particularly if it also contains polyols or added fibres. Stick with familiar, tolerated options for race days, travel and sessions where stomach comfort matters.
Gym goers focused on protein can compare protein per 100 kcal and the protein-to-sugar ratio. These measures help distinguish a protein-forward snack from a coated bar with less protein relative to its energy. If the numbers are close, digestion and whether the bar suits your routine are sensible tie-breakers.
Everyday snackers reducing added sugar can first check the 5 g per 100 g benchmark, then look for syrups, glucose solids, honey and coatings in the ingredients. Total sugars may include lactose or fruit sugars, so the ingredient list helps explain the nutrition panel. For a desk snack, portion size and tolerance may matter more than the smallest possible sugar figure.
Plant-based or dairy-avoiding shoppers should check the full ingredient and allergen statements. A plant-based label does not guarantee low sugar: fruit pastes, syrups and coatings can raise the total. Dairy-based bars may contain lactose, which contributes to total sugars. Compare the panel and ingredients rather than relying on the category name.
How much protein a bar really adds
Adult reference values provide context for a bar's contribution. The recommended daily intake is 64 g for men aged 19 to 70 and 46 g for women aged 19 to 70. For adults over 70, the figures are 81 g for men and 57 g for women. These are reference values, not individual sports targets.
A 20 g protein bar supplies approximately 31% of the adult male RDI or 43% of the adult female RDI for ages 19 to 70. That can be a meaningful snack contribution, but it is not personalised advice or a performance target.
A bar can help fill a protein gap. Your needs depend on the whole day.
If lunch was low in protein and dinner is late, a higher-protein bar may suit the gap. After protein-rich meals, a smaller bar with fewer calories may fit better, even if its protein figure is lower. Comparing protein powder with protein bars can help weigh convenience against cost and ingredients.
Build a shortlist from the label
A useful shortlist starts with actual pack information, not brand names or assumed values. Choose the exact flavour, record its serving size and nutrition figures, and calculate sugars per 100 g and protein per 100 kcal from the label. Check the sweeteners, fibre and allergens in the same flavour. Then compare its current price per serve, using the listed pack price divided by the number of bars.
For a worked example, take a hypothetical bar weighing 60 g, with 3 g sugars, 20 g protein and 200 kcal per bar. Its sugar level is 5 g per 100 g: 3 divided by 60, multiplied by 100. Its protein density is 10 g per 100 kcal: 20 divided by 200, multiplied by 100. These are example calculations, not figures for a product on sale.
Now compare a second hypothetical bar with 2 g sugars per 100 g, but less protein for the same energy and a sweetener blend you know does not suit you. It ranks lower on sugar alone, yet may be less useful as a post-training snack. A third bar could have more sugar but stronger protein per 100 kcal and a sweetener profile you tolerate. The best choice depends on the job, not one winning number.
The New Zealand Food Composition Database covers more than 3,400 foods commonly prepared and eaten in the country. That wider food context is useful: a bar is one part of the day, so read protein, carbohydrate, sugars, fat, energy and fibre together.
Two days, two different answers
A team sport player needing a snack between afternoon training and an evening game may prioritise a familiar bar that has been checked for relevant certification and sits comfortably. A slightly higher sugar figure could be a reasonable trade-off if the bar fits the player's plan and avoids an uncomfortable amount of fibre or polyols close to play.
A desk worker choosing a 3 pm snack instead of biscuits has different priorities. A higher-fibre bar may work well if it is comfortable to eat at a desk. Passing the 5 g per 100 g test, limiting added sugar ingredients and keeping the serving appropriate may matter more than achieving the lowest sugar figure on the shelf.
Same shelf, different use. Rank sugar per 100 g, protein per 100 kcal and sweetener load together, then match the result to the occasion. For each option, use the current flavour's label to make the comparison; values can differ between flavours.
The New Zealand Food Composition Database is a reference for comparing foods in the wider diet, but a packaged bar still needs to be assessed from its own label. Check the ingredients alongside the nutrition panel, then choose the option that fits your training or workday. If you are drug tested, confirm the named product and batch before ordering.
At NZ Supps, compare the live product pages and start with a small quantity if you have not tried the bar before. For drug-tested sport, check the relevant product and batch details before buying.